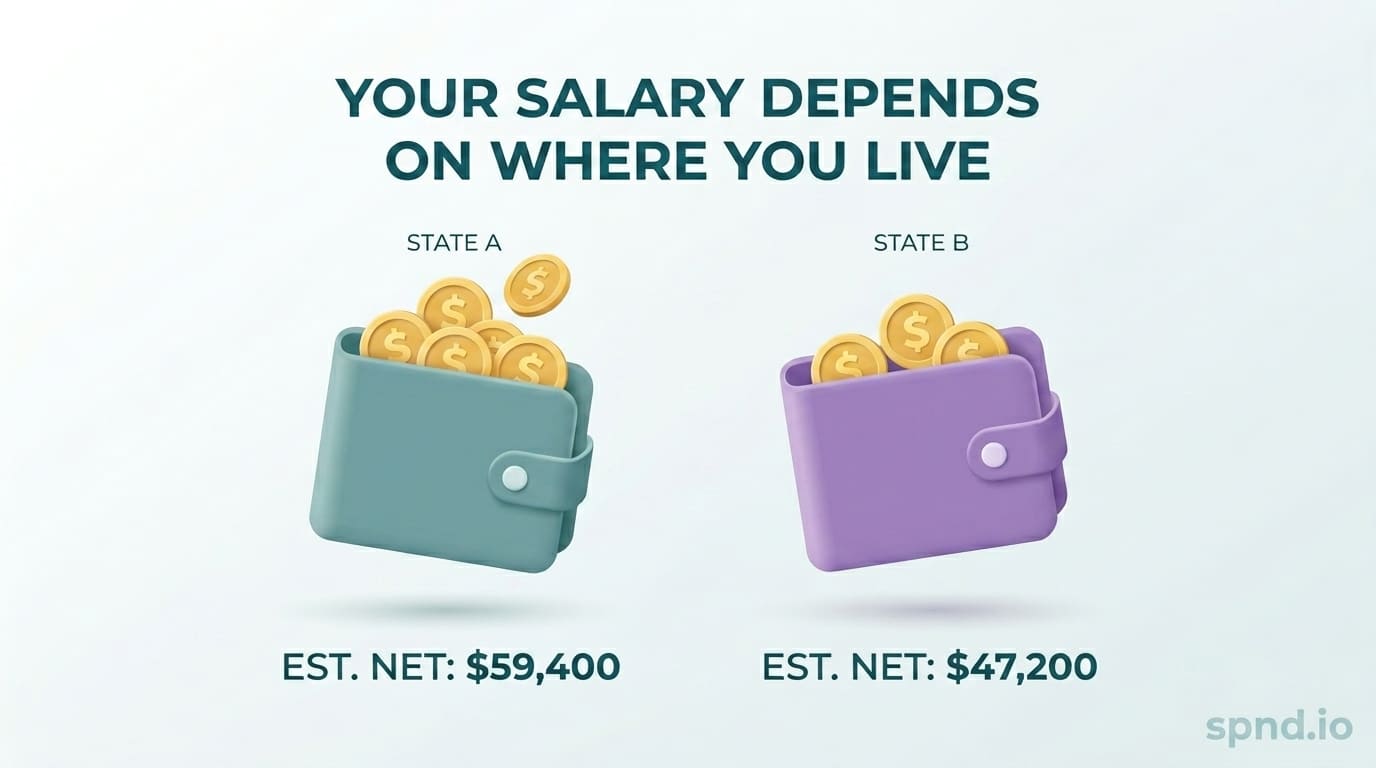
Your gross salary is the same number on every offer letter, but your take-home pay can vary by $10,000 or more per year depending on where you live. A $100,000 offer in Austin is not the same as a $100,000 offer in Quebec City, even before factoring in cost of living.
This guide breaks down actual take-home pay for common salary levels across every US state and Canadian province, plus the key factors behind the differences and what they mean for financial planning, job offers, and relocation decisions.
What Drives Take-Home Differences
Three factors explain most of the variation between locations:
-
State or provincial income tax rates — range from 0% (several US states) to over 25% marginal in some Canadian provinces
-
Social programs funded by payroll tax — Social Security and Medicare in the US, CPP and EI in Canada
-
Local taxes — some cities (NYC, San Francisco, Philadelphia) add municipal income tax on top of state
Federal income tax is consistent across each country, so differences within a country come mainly from the state/provincial layer.
US Take-Home by State: $75,000 Salary
2026 estimates for a single filer, no dependents, standard deduction, no 401(k):
No state income tax (highest take-home)
-
Texas: ~$62,000 (82.7%)
-
Florida: ~$62,000 (82.7%)
-
Tennessee: ~$62,000 (82.7%)
-
Washington: ~$62,000 (82.7%)
-
Nevada: ~$62,000 (82.7%)
-
South Dakota: ~$62,000 (82.7%)
-
Wyoming: ~$62,000 (82.7%)
-
Alaska: ~$62,000 (82.7%)
-
New Hampshire: ~$61,500 (82%) — no tax on wages, but taxes dividend/interest
Low state income tax (5% or less)
-
Arizona: ~$60,500 (80.7%)
-
Colorado: ~$60,000 (80%)
-
Michigan: ~$59,500 (79.3%)
-
North Carolina: ~$59,400 (79.2%)
-
Pennsylvania: ~$59,300 (79.1%)
-
Indiana: ~$59,200 (78.9%)
Mid-range state income tax (5-7%)
-
Massachusetts: ~$58,500 (78%)
-
Virginia: ~$58,000 (77.3%)
-
Georgia: ~$58,000 (77.3%)
-
Maryland: ~$57,700 (76.9%)
-
Connecticut: ~$57,500 (76.7%)
Higher state income tax (7%+)
-
New York (outside NYC): ~$57,200 (76.3%)
-
New Jersey: ~$57,000 (76%)
-
Oregon: ~$56,800 (75.7%)
-
Minnesota: ~$56,500 (75.3%)
-
California: ~$57,000 (76%)
-
Hawaii: ~$56,000 (74.7%)
With local tax layered on
-
New York City: ~$54,700 (72.9%) — adds NYC income tax
-
Philadelphia: ~$56,200 (74.9%) — adds city wage tax
-
San Francisco / LA: no city income tax on wages, same as California above
Canadian Take-Home by Province: $75,000 Salary
2026 estimates, single filer, no dependents, basic personal amount applied. Values in CAD:
Lowest provincial tax rates
-
Alberta: ~$58,000 (77.3%)
-
Saskatchewan: ~$57,000 (76%)
-
Ontario: ~$57,400 (76.5%)
-
British Columbia: ~$57,800 (77.1%)
Mid-range
-
Manitoba: ~$56,000 (74.7%)
-
New Brunswick: ~$55,200 (73.6%)
-
Nova Scotia: ~$55,000 (73.3%)
-
Prince Edward Island: ~$54,800 (73.1%)
-
Newfoundland and Labrador: ~$55,500 (74%)
Highest
-
Quebec: ~$52,000 (69.3%) — significantly higher provincial tax and mandatory QPP (Quebec Pension Plan) contributions replace federal CPP
How It Scales: $50K, $100K, $150K
Progressive tax systems in both countries mean the percentage kept decreases as income rises. Comparing California and Ontario across salary levels:
California, single filer
-
$50,000 → ~$40,400 take-home (80.8%)
-
$75,000 → ~$57,000 (76%)
-
$100,000 → ~$72,500 (72.5%)
-
$150,000 → ~$103,000 (68.7%)
-
$250,000 → ~$160,500 (64.2%)
Ontario, single filer (CAD)
-
$50,000 → ~$40,200 take-home (80.4%)
-
$75,000 → ~$57,400 (76.5%)
-
$100,000 → ~$73,700 (73.7%)
-
$150,000 → ~$104,500 (69.7%)
-
$250,000 → ~$160,500 (64.2%)
Texas (no state tax), single filer
-
$50,000 → ~$42,100 (84.2%)
-
$75,000 → ~$62,000 (82.7%)
-
$100,000 → ~$79,500 (79.5%)
-
$150,000 → ~$114,500 (76.3%)
-
$250,000 → ~$180,000 (72%)
Notice how the spread between locations grows at higher incomes. At $50,000 the difference between Texas and California is only $1,700/year. At $250,000 it is $19,500/year.
What About Cost of Living?
Tax is only part of the story. The states and provinces with the lowest taxes often have higher housing costs (the classic California vs Texas trade is partly housing, not just taxes). The real question is not 'which state takes less,' it is 'which location gives me the best after-tax, after-housing take-home.'
Rough comparison of net income after a median 2-bedroom apartment rent (2026 estimates):
-
Austin, TX at $75K: $62,000 net - $20,000 rent = $42,000 disposable
-
Toronto, ON at $75K CAD: $57,400 net - $27,000 rent = $30,400 disposable
-
San Francisco at $75K: $57,000 net - $36,000 rent = $21,000 disposable
-
Dallas, TX at $75K: $62,000 net - $18,000 rent = $44,000 disposable
For most people, the housing-cost gap dwarfs the tax-rate gap. A 'low-tax state' with extreme housing costs is not actually high take-home once you subtract rent or mortgage.
What This Means for Job Offers
Three rules when comparing offers across locations:
-
Translate every offer into after-tax monthly net for the specific location — not gross
-
Subtract housing cost (at the style you want to live, not what locals tolerate) to get disposable
-
Compare disposable income, not gross income, when evaluating offers
A $90K offer in Austin with $1,600 rent often beats a $120K offer in San Francisco with $3,200 rent, once you run the math. The second offer sounds 33% better and can be 20% worse in practice.
What This Means for Remote Work
If you work remotely and can choose your location, you have optionality most people do not. A few honest observations:
-
Moving from a high-tax state to a no-tax state for the same salary can legitimately add $5,000-$20,000/year to take-home, depending on income
-
Some employers adjust remote salary by location — if your company 'location-adjusts,' the tax savings may be partly offset
-
Some states (California, New York) pursue tax claims on residents who relocate. Consult a tax professional for clean breaks.
-
Cross-border moves (US-Canada) create significant complexity — tax residency, healthcare, banking, retirement accounts. Not a casual decision.
The Retirement Account Angle
Pre-tax retirement contributions can materially shift your effective take-home. Maxing a 401(k) at $23,500 (2026) on a $100,000 salary in California:
-
Without 401(k): net ~$72,500, saved ~$0 in retirement
-
With max 401(k): net ~$58,800, saved $23,500 — total personal equity built: $82,300
The 401(k) contribution is real tax savings of roughly $8,000 in this example, plus the invested money grows tax-deferred. The after-tax portion of your paycheck looks smaller, but your total financial position is meaningfully better. This is one of the easiest ways to 'raise' your true take-home value.
Getting Your Exact Number
The numbers above are estimates based on common filer scenarios. Your actual take-home depends on filing status, dependents, pre-tax deductions, local taxes, marginal bracket thresholds, and a dozen other factors.
Before making relocation decisions, job comparisons, or budget plans, always run your specific numbers. A generic state average is off by $2,000-$5,000 for most real situations because individual circumstances shift the calculation.
Want your real number? The free Net Income Calculator on spnd.io computes exact take-home pay for any US state or Canadian province, accounting for your filing status, deductions, and pre-tax contributions. Compare two locations side-by-side before any job change or move.